Nitto Group Report 2016
15/44
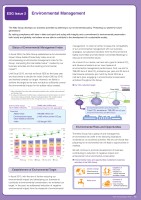
14Nitto Group Report 2016Environmental ManagementStatus of Environmental Management IndexIn scal 2004, the Nitto Group established an Environmental Impact Value-Added Productivity Index as an all-encompassing environmental management index for the Group, calculating the total added value*1 created by our business activities and the resulting environmental impact*2. Until scal 2015, we had set scal 2005 as the base year and had aimed to double the index (Index=200) by 2015 and worked towards our target. However, we failed to achieve the target as we were not able to sufciently control the environmental impact for the added value created.*1Value calculated from sales after subtracting material costs, outside order expenses and energy costs*2A unique unit utilized by the Nitto Group, indicating environmental impact, into which we convert energy purchased, industrial waste generated, VOC (volatile organic compounds) purchased and the like, through the use of a coefficient management. In order to further increase the compatibility of our environmental management with our business strategies, we selected members from the Environment & Safety Committee and held Green Committee Meetings to discuss environmental issues. As a result of our review, we have set a goal to reduce CO2 and toluene emissions as our new measure of environmental management performance. First, we aim for 789,000 tons of total CO2 emissions per year and 25 tons of total toluene emissions per month by scal 2018 as a mid-term goal, engaging in environmental conservation activities throughout the Group.ESG Issue 2The Nitto Group develops our business activities by adhering to our environmental policy, “Protecting our planet for future generations”. By valuing compliance with laws in letter and spirit and acting with integrity and a commitment to environmental preservation both locally and globally, we believe we are able to contribute to the development of a sustainable society.02004006008001,0001,2001,400020406080100120140Environmental impact (1,000ton-CO2eq)(Index)2005100201420152013201020112012(FY)363162201151111109119128479210262485203259101115423178221424203241431195201426202217Energy VOC Waste Other GHG IndexEnvironmental impact value-added productivityEnvironmental impact value-added productivity=Fiscal 2015Added value (million yen) Added value: 438,388 million yen: 0.463 million yen/ton-CO2eq: 128 (target: 200)IndexEnvironmental Impact (in CO2 equivalent)Fiscal 2018Fiscal 2020Fiscal 2025CO2 emissions(Scopes 1+2)TargetEstimateEnvironmental mid-term plan (Fiscal 2018) Total CO2 emissions: 789,000 ton CO2/year(Fiscal 2015 Performance: 837,894 ton/year)Climate change•Global warming•Abnormal weatherWater crisisDepletion of resources• Depletion of energy resources•Increase of wasteDecrease of biodiversity• Use of harmful chemical substances• Our CO2 reduction target• Environmental risks and opportunities incidental to business activities of the Nitto GroupEnvironmental Risks and OpportunitiesThe Nitto Group has a grasp of and manages key environmental risk (refer to the following illustration) incidental to our business activities. We are convinced that preparing for environmental risk will lead to opportunities in markets.We will continue to promote development of business contributing to reduction of negative impact and enhancement of environmental conservation.Establishment of Environmental TargetIn scal 2015, with the aim of further reducing our environmental impact and developing our business to contribute to environmental conservation, we reviewed our target. In the past, we addressed reduction of negative environmental impact from the viewpoint of environmental
元のページ