Nitto Group Report 2016
35/44
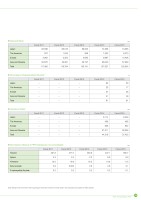
34Nitto Group Report 2016• Disposed Waste• Percentage of Disposed Waste Recycled*• Hazardous Waste*• Atomospheric Release of PRTR Substances (non-consolidated) Fiscal 2011Fiscal 2012Fiscal 2013Fiscal 2014Fiscal 2015Japan62,59666,01666,92374,65873,365The Americas8721,0349367,5328,370Europe3,0623,3533,6859,69710,426Asia and Oceania50,87049,38159,19766,04057,893Total117,400119,784130,741157,927150,054Fiscal 2011Fiscal 2012Fiscal 2013Fiscal 2014Fiscal 2015Japan−−−9293The Americas−−−2317Europe−−−5756Asia and Oceania−−−3128Total−−−6161Fiscal 2011Fiscal 2012Fiscal 2013Fiscal 2014Fiscal 2015Japan−−−6,1146,248The Americas−−−438495Europe−−−656654Asia and Oceania−−−37,31130,055Total−−−44,51937,452Fiscal 2011Fiscal 2012Fiscal 2013Fiscal 2014Fiscal 2015Toluene461.8 477.0 463.8437.1585.7Xylene3.2 2.5 2.28.99.0N-hexane10.0 16.9 18.310.611.5Butyl acrylate3.9 0.003 2.62.63.12-hydroxyethyl Acrylate0.2 0.2 0.20.20.1ton%tontonData relating to the environment: Some past gures have been revised. Formulae used in the calculations are posted on Nitto’s website.
元のページ