Nitto Group Report 2016
39/44
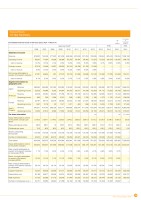
38Nitto Group Report 2016Business Results 10-Year Summary Consolidated financial results of the fiscal years (April 1- March 31)Japanese GAAPIFRSIFRS200620072008200920102011201220132013201420152015Statement of incomeRevenue679,822745,259577,922601,859638,556607,639671,253749,835749,504825,243793,0547,038,108Operating income69,03777,95413,83856,08685,24556,49168,48272,25472,503106,734102,397908,742ratio to revenue10.2%10.5%2.4%9.3%13.3%9.3%10.2%9.6%9.7%12.9%12.9%12.9%Ordinary income67,31974,46814,80758,83385,14358,43667,18271,658————ratio to revenue9.9%10.0%2.6%9.8%13.3%9.6%10.0%9.6%————Net income attributable to owners of the parent company41,20146,63426737,57055,74331,06643,69651,01851,89277,87681,683724,911ratio to revenue6.1%6.3%0.0%6.2%8.7%5.1%6.5%6.8%6.9%9.4%10.3%10.3%Segment information by geographic areaJapanRevenue268,364256,288207,263203,982218,528194,636192,600186,320185,990189,779180,9871,606,203Operating income52,53544,9693,30534,89764,37639,57144,33843,26344,11270,32260,793539,519AmericasRevenue42,34945,05439,00237,76636,11635,73940,01452,08552,08559,45175,344668,655Operating income-663338-1,2982,012-289-1,3631,7681,1981,373-1,72512,241108,635EuropeRevenue23,78729,17225,51926,93323,24521,18931,05738,83438,83443,04142,750379,393Operating income1,5872,178-201,1471,4714808983,1043,0252,7293,08127,343Asia & OceaniaRevenue345,321414,743306,136333,177360,665356,074411,942472,594472,594532,971493,9724,383,848Operating income12,38227,6148,36817,95219,03215,51420,25822,15823,87436,57324,410216,631Per share informationYenYenU.S. dollarsEquity attributable to owners of the parent company per share2,192.32,297.12,148.22,320.92,540.32,635.92,961.93,172.03,159.93,706.03,785.933.60Basic earnings per share248.3280.11.6225.5337.4188.9265.5309.3314.6471.8495.24.40Dividends per share70.080.080.040.090.0100.0100.0100.0100.0120.0140.01.24Shares outstanding (thousands)173,758173,758173,758173,758173,758173,758173,758173,758173,758173,758173,758—Number of shareholders35,22441,30963,47966,03259,05965,32149,23455,00955,00935,01437,694—Total assets604,208595,972558,258624,992653,961651,908740,949781,352783,583855,433825,9057,329,650Equity attributable to owners of the parent company364,942382,627357,839386,664417,606433,541488,179523,391521,385612,016614,4255,452,831Ratio of profit attributable to owners of the parent company to total assets (ROA)7.1%7.8%0.0%6.4%8.7%4.8%6.3%6.7%6.8%9.5%9.7%—Return on equity attributable to owners of the parent company (ROE)12.0%12.5%0.1%10.1%13.9%7.3%9.5%10.1%10.5%13.7%13.3%—Ratio of equity attributable to owners of the parent company to total assets60.4%64.2%64.1%61.9%63.9%66.5%65.9%67.0%66.5%71.5%74.4%—Capital investment75,32459,40655,92637,14726,88233,75849,80775,81475,81456,72160,420536,209Depreciation cost40,16949,61750,55644,81039,94036,80636,46743,18843,22345,66248,537430,751R&D expenses21,73322,09621,71620,87621,94925,00327,57328,57328,44428,24032,120285,055Number of employees (Note 1)32,10133,66328,64031,28833,19232,19830,38231,50431,50431,99730,007—YeninMillionsU.S. dollarsinThousands(Note 2)
元のページ