Nitto Group Report 2016
7/44
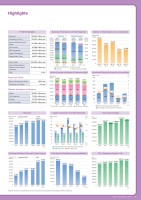
6Nitto Group Report 2016Highlights0100,000200,000300,000400,000500,000600,000700,000800,000900,0002013*201120122013(FY)607,639Japanese GAAPIFRS671,253749,835749,5042014825,2432015793,054(Millions of yen)0100,000200,000300,000400,000500,000600,000700,000800,000900,000020,00040,00060,00080,000100,000120,0002014201420152015(FY)316,608509,28540,829Total:825,243322,155455,83153,367Total:793,054−41,479−38,299−4,383−2,83921,20587,5042,406Total:106,73428,61465,44411,179Total:102,397Operating incomeRevenueMedical & MembraneOptronicsIndustrial tapeIntercompany eliminations(Millions)of yen(Millions)of yen010203040506070800.01.53.04.56.020142015201120122013(FY)56.728.260.432.175.833.749.828.525.027.5(Billions of yen)(%)Capital investment (completed contract method)R&D expenses R&D / Sales ratio3.43.84.14.14.1010,00020,00030,00040,00050,00060,00070,00037,694(Shareholders)Mar. 31,201635,014Mar. 31,201555,00949,23465,321Mar. 31,2014Mar. 31,2012Mar. 31,201301,000,0002,000,0003,000,0004,000,0005,000,0006,000,0007,000,000(GJ)200520142015201120122013(FY)4,945,5745,952,7225,839,9995,799,8106,754,8376,681,554010,00020,00030,00040,00050,00060,00070,00080,00090,0002013*20112012201331,066(FY)Japanese GAAPIFRS(Millions of yen)43,69651,01851,892201477,876201581,68305,00010,00015,00020,00025,00030,00035,000Mar. 31,2016(Employees)30%9%5%37%19%Mar. 31,201528%8%5%39%20%Mar. 31,2014Mar. 31,2012Mar. 31,201329%8%4%40%19%28%6%3%43%20%30%8%4%40%18%31,99730,00731,50432,19830,382South Asia East Asia Europe The Americas Japan050,000100,000150,000200,000250,000300,000350,000400,000202,245(Thousands of yen)2014117,8562015295,280312,267368,587201320112012(FY)02004006008001,0001,2001,400012345672600.85011.2(Millions of yen)(%)Environmental equipment investmentPercentage of total equipment investment201420151,1082.45192.61,0453.5201320112012(FY)0100,000200,000300,000400,000500,000600,000700,000800,000900,000(Ton)200520142015201320112012(FY)719,472853,132837,894746,266758,059772,119Revenue793,054 million yenOperating Income102,397 million yenIncome before Income Taxes101,996 million yenNet Income81,989 million yenR&D Expenses32,120 million yenCapital Investment60,420 million yenDepreciation Cost48,537 million yenAmount per ShareBasic Earnings per Share495.2 yenDividends per Share140 yenRegional Breakdown of RevenueJapan180,987 million yenThe Americas75,344 million yenEurope42,750 million yenAsia & Oceania493,972 million yenTotal Assets825,905 million yenEquity Attributable to Owners of the Parent Company614,425 million yenROE13.3%FY2015 HighlightsRevenueBusiness Performance of Each SegmentCapital Investment and R&D ExpensesNumber of Shareholders (non-consolidated)Total Input EnergiesNet Income Attributable to Owners of the Parent CompanyNumber of Employees and Breakdown of Employees by RegionTotal Amount Donated (non-consolidated)Environmental Equipment Investment (non-consolidated)CO2 Emissions (Scopes 1+2)*Data for revenue and operating income in scal 2013 are presented according to IFRS for reference.
元のページ