Recognizing that responding to climate change is an important management issue, the Nitto Group has strategically included such responses in its management agenda and announced its support for the recommendations by the Task Force on Climate-related Financial Disclosures (TCFD) in May 2022. After announcing our support, every year, we assess the impact that climate-change-related risks and opportunities may have on our business and make revisions as necessary. In fiscal years 2025 and 2026, we have further accelerated our response to climate change and, in order to enhance its effectiveness, established new targets and indicators, including GHG emission reduction targets by scope.
The Nitto Group has set “responding to climate change” as one of its material issues for sustainability and is strengthening its efforts in this area. The Group is formulating and promoting short- to medium-term and long-term strategies including environment for each issue by establishing a sustainability governance system, where the Corporate Strategy Meeting body (the President and COO serves as the chair of the Corporate Strategy Meeting) plays the central role under the direction and supervision of the Board of Directors (the Chairman of the Board and CEO serves as the chair of the Board of Directors). In addition, in order to increase the effectiveness of environmental initiatives including climate change response, the Group has established the Global Green Committee led by the Vice President in charge of promoting climate change-related issues and strengthen cross-organizational coalitions while examining strategies and implementing and promoting countermeasures against the issues. The Nitto Group's governance structure is as follows:
The Group places ESG (Environment, Society and Governance) at the core of its management. As such, rather than establishing a general sustainability committee or ESG committee, we use the Corporate Strategy Meeting, chaired by the President & COO and comprising of all Vice Presidents, as a platform to discuss the promotion of ESG management. This enables us to incorporate ESG into management in a swift and appropriate manner, and to achieve governance that ensures higher feasibility by integrating the company’s sustainability and growth strategy.
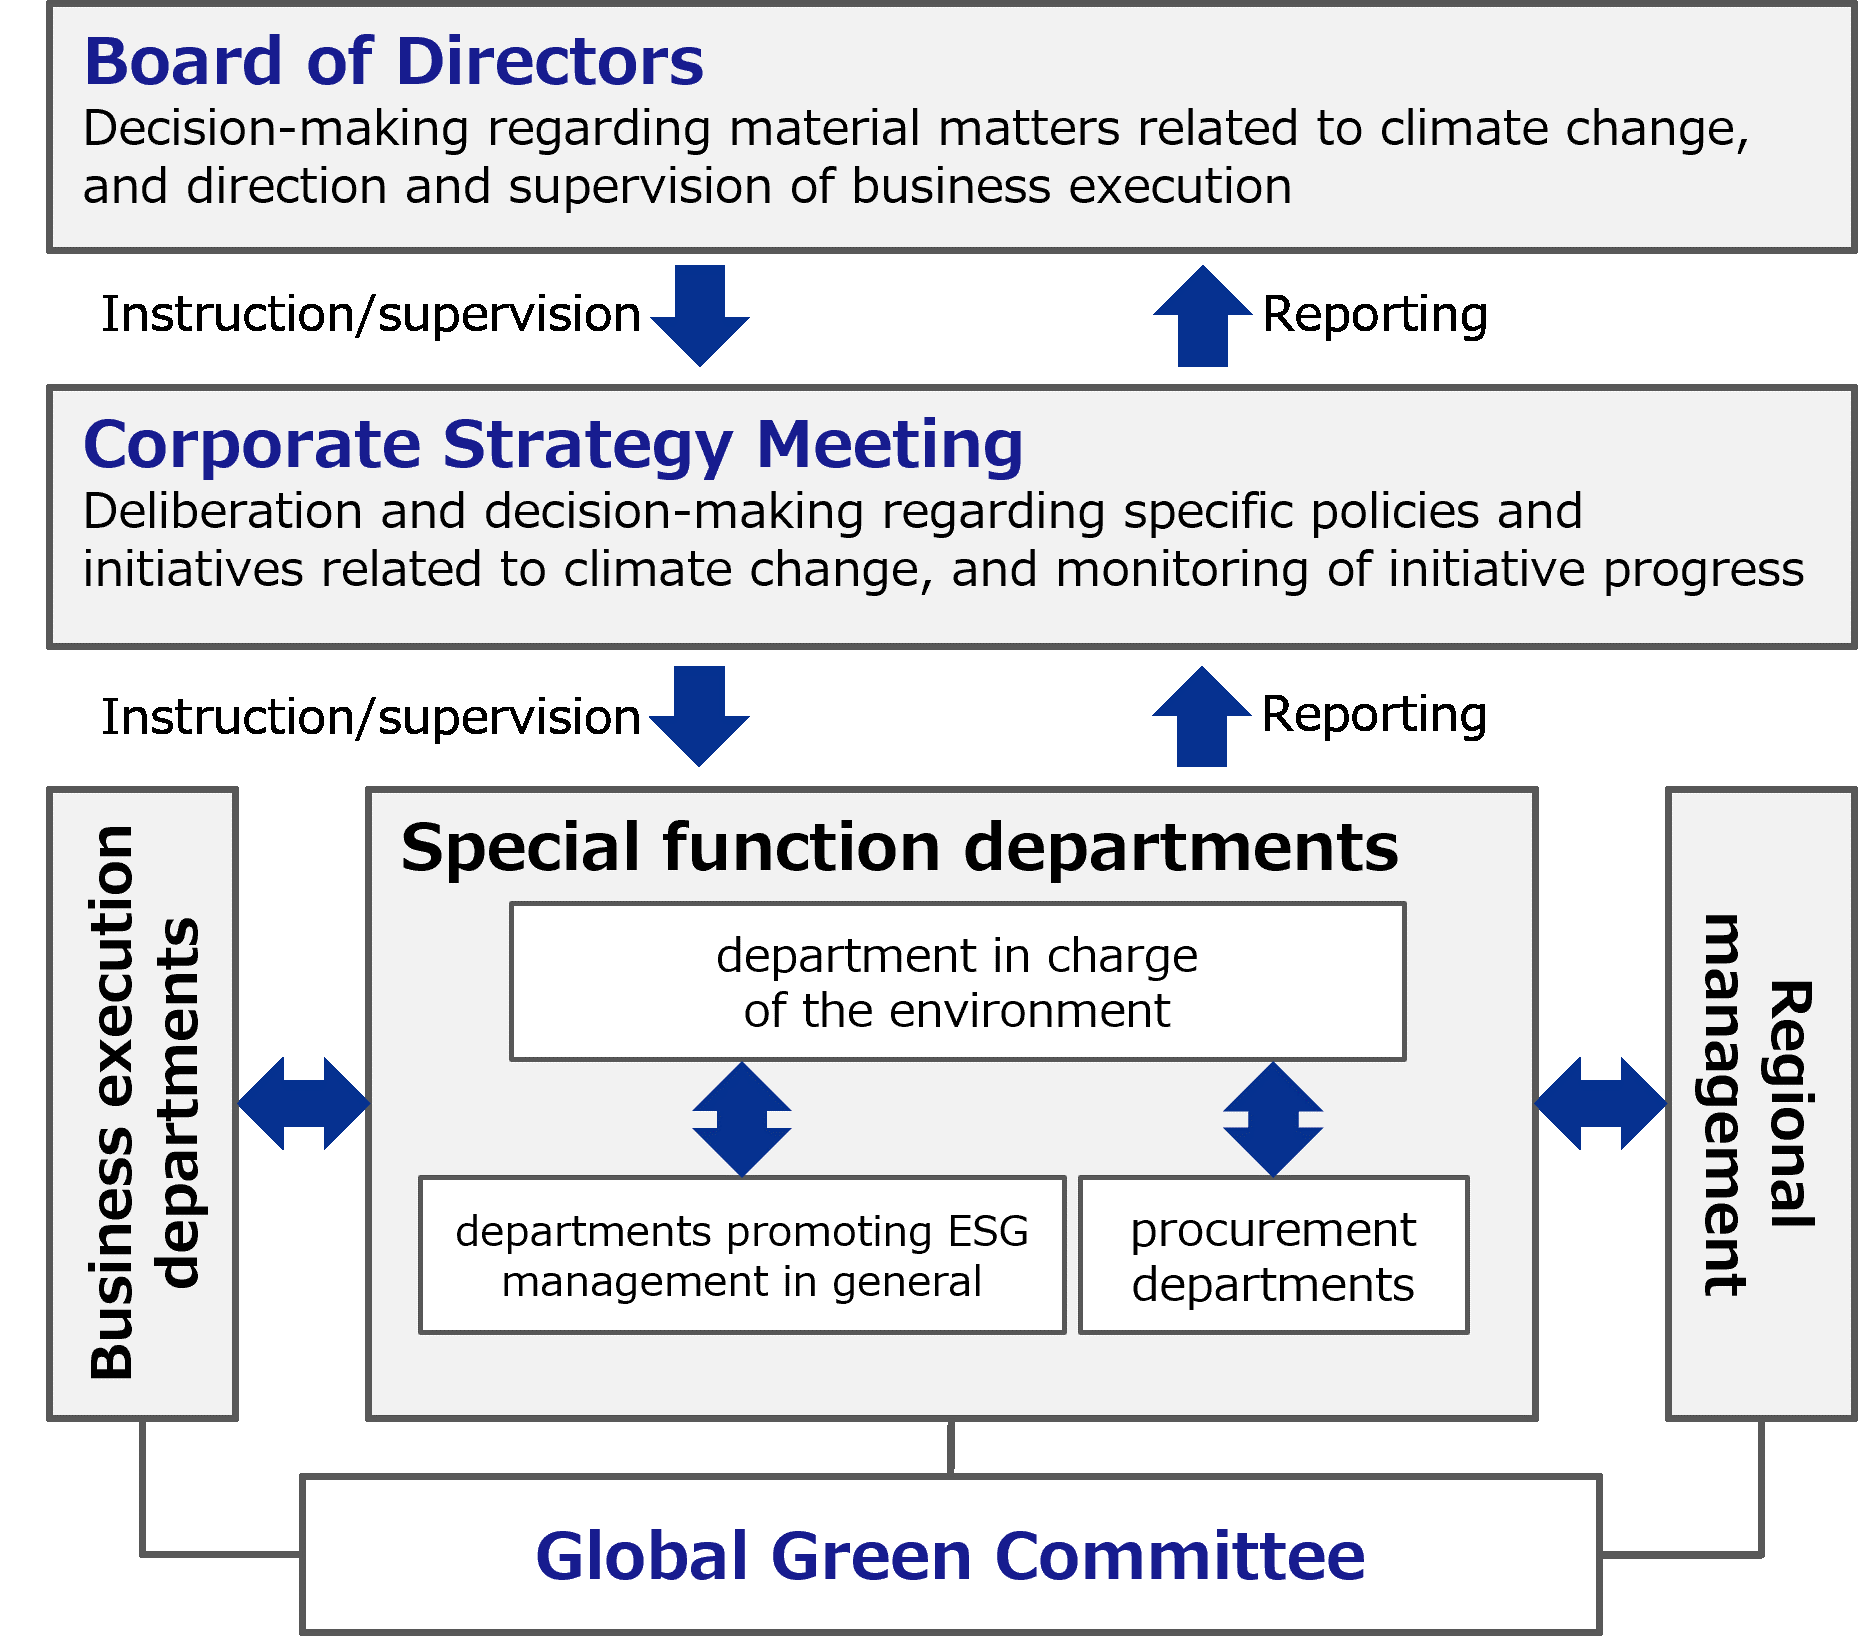
The Board of Directors makes decisions on important matters, for instance, management policies, management indicators and targets related to the environment including climate change (future-financial targets and indicators), such as the mid-term management plan and support for external initiatives. Each quarter, it provides periodic directions, and conducts supervision, concerning the climate change targets (future-financial targets and indicators) of the mid-term management plan as well as the status of progress toward target achievement, and, as necessary, adds new items to the agenda if a material matter arises.
The Board of Directors is comprised of Directors who possess qualifications, knowledge, and experience related to sustainability, including climate change, and who thus impart it with a sustainable and greater supervision function.
Please see the section below for the skills of each Director.
Policies related to the Board of Directors (members) and the Board of Corporate Auditors (members) Nitto Group Integrated Report 2025(P.59 Skills Matrix)
At the Nitto Group, we have adopted a compensation system that links remuneration to performance, on the premise that management, including directors and executive officers, is accountable for their respective roles and performance responsibilities. As a medium- to long-term incentive, we have introduced performance-linked restricted share remuneration, which is calculated based on performance and ESG initiative results during a specified evaluation period and the shares are released upon retirement with the restrictions lifted. This performance-linked restricted share remuneration is designed to vary within a range of 0% to 150% depending on the evaluation results, and the evaluation indicators incorporate not only financial metrics such as consolidated operating profit, operating profit margin, and consolidated ROE, but also ESG initiatives results, including responses to climate change. The evaluation ratio for ESG initiatives results is set at 30% of the total.
The Corporate Strategy Meeting is responsible for deliberation and decision-making regarding specific policies and measures for action based on management policies and management indicators regarding the environment including climate change, as well as managing risks and opportunities and monitoring progress towards achieving targets on a monthly basis. It provides periodic reports––on a quarterly basis––to the Board of Directors on its deliberations and decisions and the progress of initiatives, and, as necessary, provides additional reports if a material matter arises. Additionally, to ensure that the matters deliberated and decided are promptly disseminated throughout the company, the Corporate Strategy Meeting comprises all Vice Presidents who are in charge of business execution departments, special function departments, and regional management.
We appoint the Vice President in charge of promoting environmental initiatives including climate change, and also have special function departments responsible for implementing those initiatives that serves as a department in charge of the environment. The department regularly assesses the risks and opportunities related to climate change, considers strategies (including transition plans), as well as executes and promotes measures to tackle climate change issues. The Vice President manages the results of these assessments, the details of their consideration, and their implementation and promotion.
In order to enhance the feasibility of climate change initiatives, we have established the Global Green Committee that is managed by the Vice President in charge of promoting climate change initiatives, aiming to strengthen cross-organizational cooperation among the various functional departments involved, including departments promoting ESG management in general, procurement departments, business execution departments, and regional management. The major activities of the Global Green Committee are as follows:
The progress of these initiatives is periodically reported to the Corporate Strategy Meeting primarily by the department in charge of the environment.
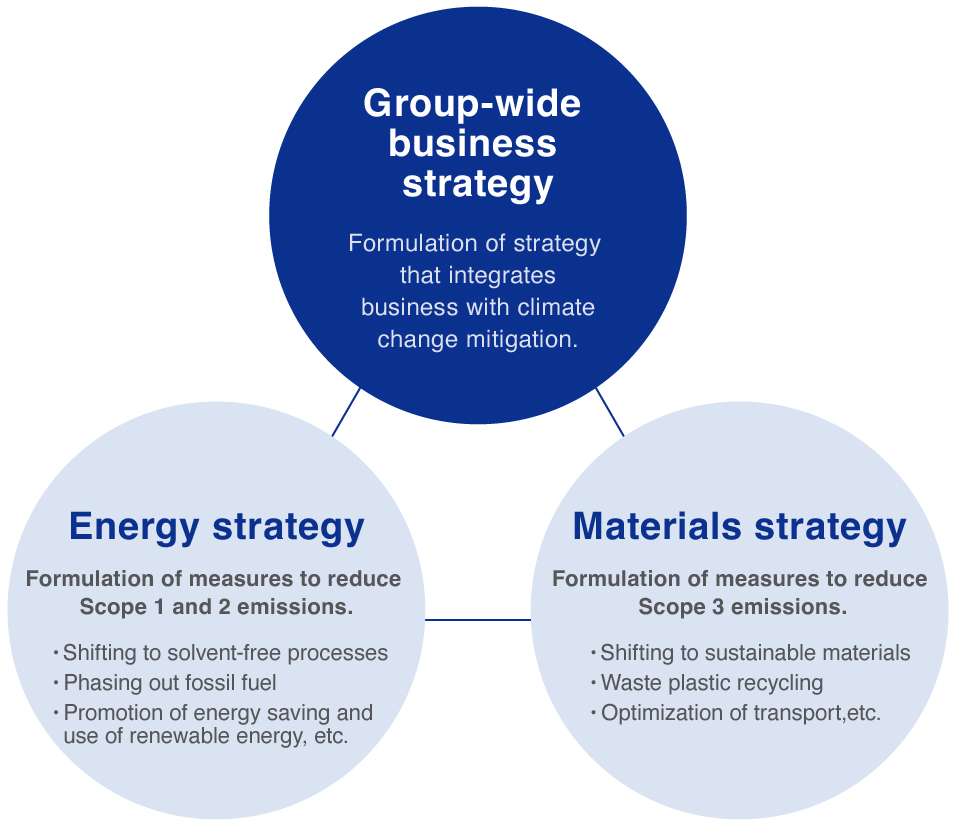
The major activities of the Global Green Committee
The Group appropriately manages key risks and opportunities related to climate change that management recognizes may significantly impact its business activities, and implements comprehensive management across the Group by combining them with other key risks that also significantly impact its business activities.
Regarding key risks and opportunities related to climate change in business activities, the Group understands the impact of changes in the internal and external environment; evaluates and identifies(selects) relative importance based on the “magnitude of impact” on business in the case of an incident and the “possibility of occurrence”; and determines the priority of the risks and opportunities.
We utilize scenario analysis to identify the risks and opportunities associated with the shift to a low-carbon economy that are expected due to climate change, as well as the risks of physical damage posed by factors such as extreme weather, for not only Nitto but the entire value chain stretching from our suppliers to customers, and then make a qualitative and quantitative assessment of the possible financial impacts.
The Nitto Group appropriately manages the identified major risks and opportunities associated with environment issues including climate change under the Risk Management Promotion System below.
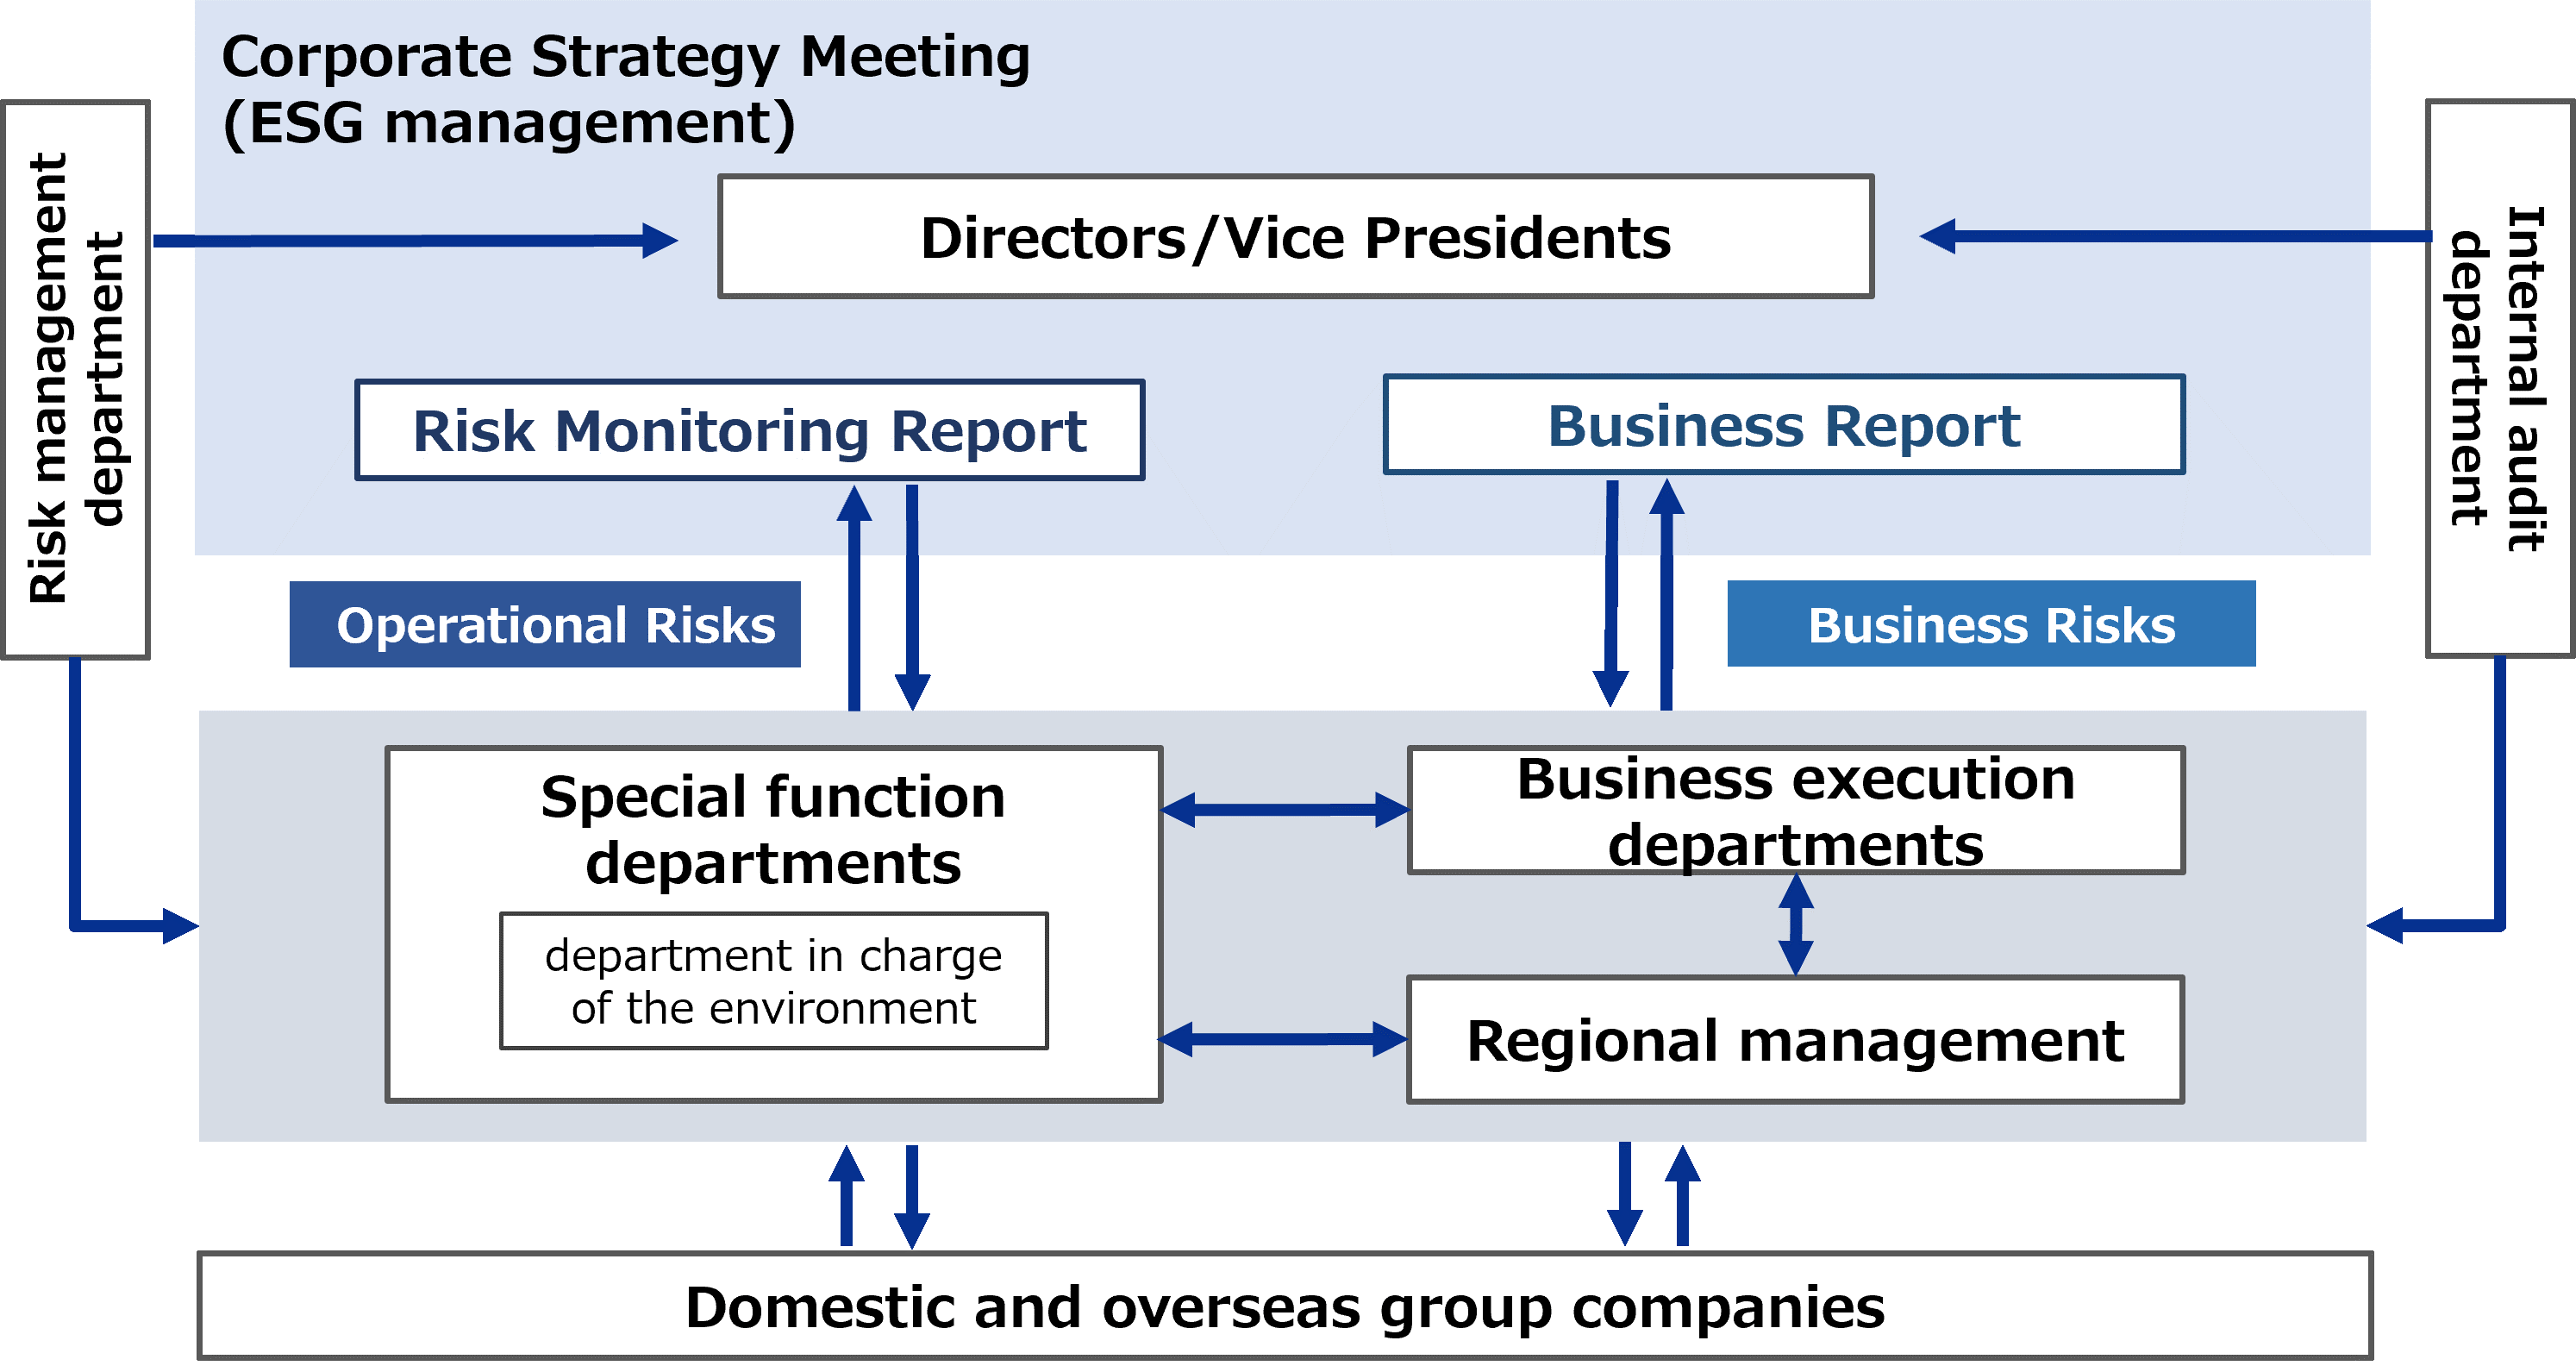
The key risks and opportunities related to the environment issues including climate change will be monitored by business execution departments and regional management teams in collaboration, while the department responsible for environmental issues will assume responsibility for managing them. Information regarding monitored risks, together with information managed by other special function departments, will be reported and deliberated monthly at the Corporate Strategy Meeting, which consists of Directors and Vice Presidents. The results of the deliberations will be instantly instructed to each responsible department and countermeasures will be promptly taken to strengthen controls. The progress of the implementation and improvement will be again reported to the Corporate Strategy Meeting to increase the effectiveness of the Group management.
At the end of the fiscal year, the department in charge of the environment, as the department responsible for the environment management, conducts a self-evaluation on the major risks associated with the environment issues including climate change that were reported and reviewed in the Corporate Strategy Meeting in accordance with evaluation criteria such as the implementation structure establishment, controls and preventative measures implementation, and the occurrence of incidents as well as the responses to them. The department in charge of risk management evaluates the results of the self-evaluation from an independent viewpoint. The risk management department and the Vice President in charge of risk management independently conduct evaluations based on established criteria and report the results to the Corporate Strategy Meeting and the Board of Directors.
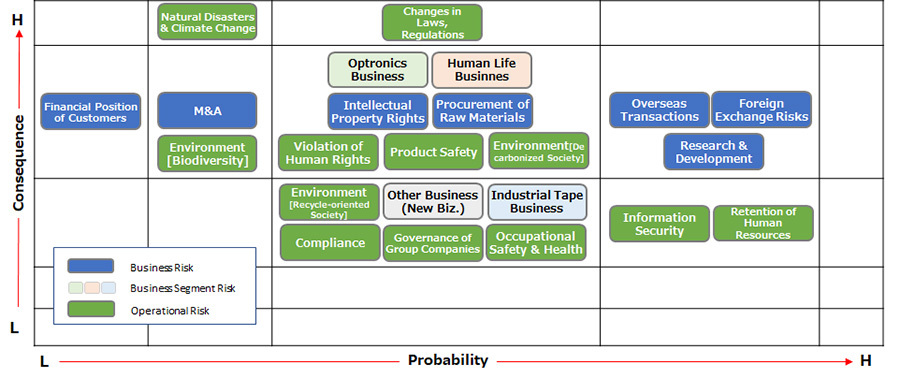
As a group, we manage risks and opportunities related to the environment issues including climate change comprehensively by integrating them with other major risks that significantly impact our business operations. We assess the relative importance of individual risks by analyzing them using a graph with two axes––a vertical axis representing the “degree of impact” on our business in case of occurrence or manifestation, and a horizontal axis representing the “probability of occurrence”––and recognize the significance of climate change risks among group-wide risks. We categorize these group-wide risks into “business risks,” which are associated with our businesses, and “operational risks,” which can generate group-wide impact, and implement appropriate risk management on a group basis. The major group-wide risks in fiscal 2025 are as follows. Please see here for more details.
Risk map of the current fiscal year
In line with external trends, as exemplified by the conclusion of the 2015 Paris Agreement and the Japanese government’s carbon-neutral declaration, the Group carried out a scenario analysis regarding transition risks and physical risks and opportunities expected due to climate change across the entire value chain, which includes not only the Group but also its suppliers and customers. The results of the scenario analysis have been incorporated into the Nitto Group Carbon Neutral 2050, as well as 2030 management targets and the medium-term management plan Nitto RISE 2028. The Group has promoted initiatives to shift to solvent-free, save energy, use renewable energy, and create products that contribute to the environment, and confirmed that it would be able to minimize risks and maximize opportunities, and that the strategy would be useful.
The Group recognizes “responding to climate change” as its material management issue and strategically incorporates them into its management.
We forecast the impact that changes in the business environment caused by climate change may have on our businesses and management, and then create scenarios based on this. We consider the “1.5°C scenario,” under which the average global temperature does not exceed that of preindustrial times by more than 1.5°C by 2050, and the “4°C scenario,” under which the average global temperature is likely to exceed that of preindustrial times by 3.2 to 5.4°C by 2050.
These scenarios are created based on information published by the international organizations indicated below. The business environment assumed in each scenario is as follows.
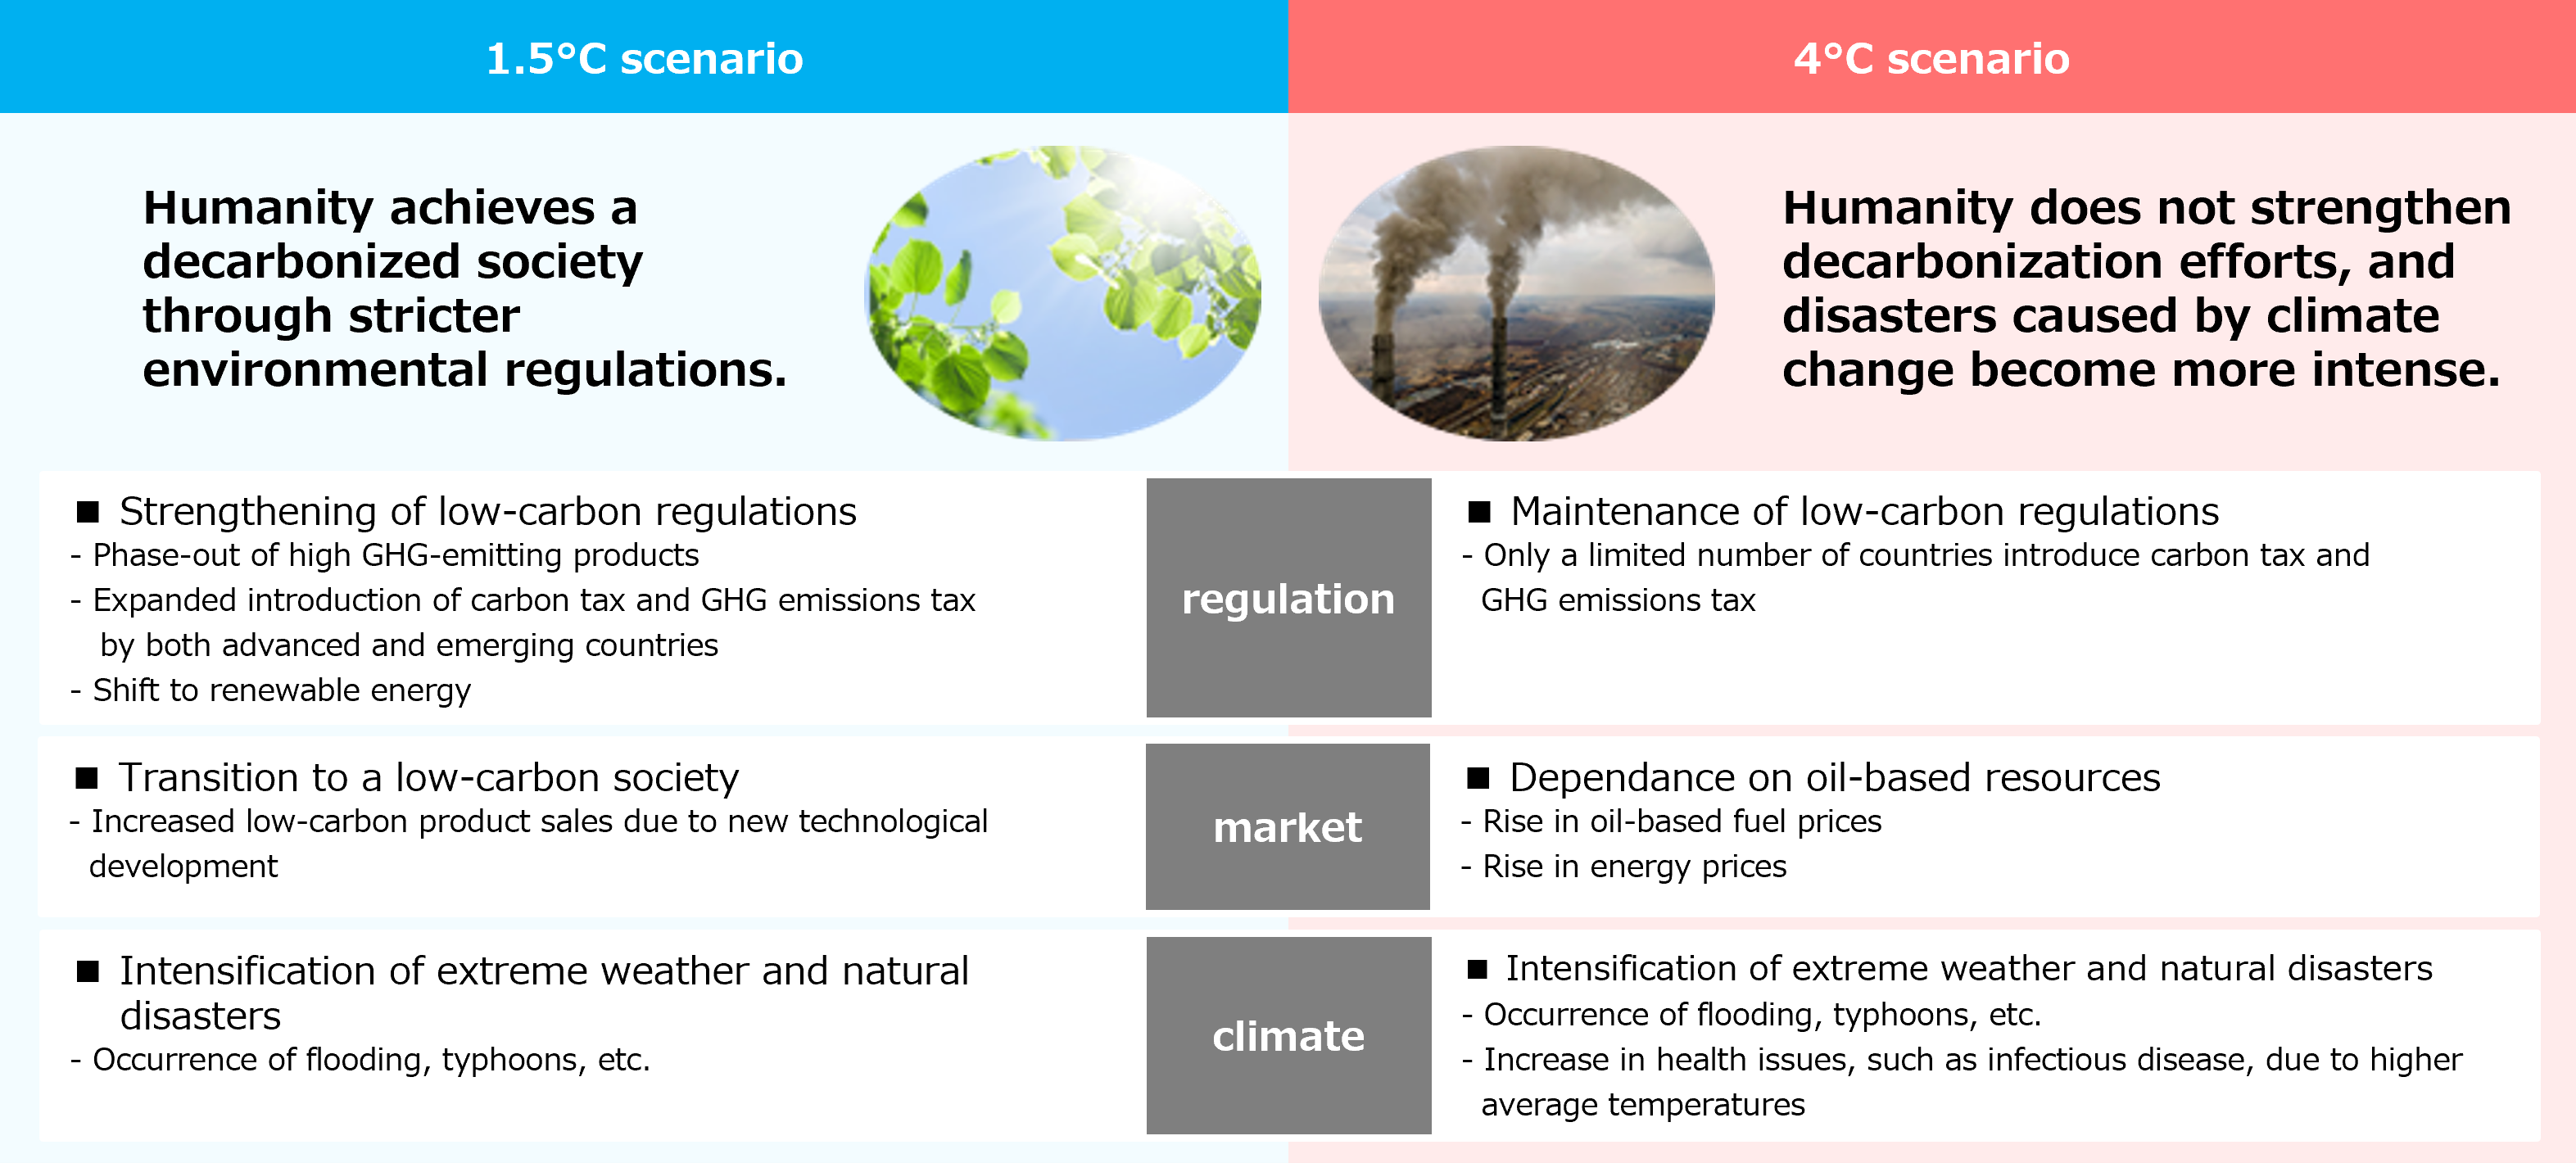
We identify the risks and opportunities in the short term (less than three years), medium term (three to five years), and long term (five years or more) under the business environment assumed in the respective scenarios. The short-term and medium-term risks and opportunities are reflected in the medium-term management plan. For the long-term risks and opportunities, we conduct a financial quantitative analysis to identify the business impact (financial impact) in the event that the respective scenarios materialize. The business impacts in the medium and long term are as follows.
| Type of risk/opportunity | Event | Assumed risks and opportunities | Impact calculation item | 1.5℃ | 4℃ | |||
|---|---|---|---|---|---|---|---|---|
| 2030 | 2050 | 2030 | 2050 | |||||
| Transition risks | Policy and laws and regulations | Strengthening of low carbon regulations | An increase in transition costs (raw material costs) to low GHG-emitting raw materials | Increased costs for switching to sustainable raw materials | Large | Large | ー | ー |
| A substantial increase in renewable energy procurement costs due to the spread of renewable energy | Increased costs for renewable energy procurement | Small | Small | ー | ー | |||
| An increase in capital expenditure (installation costs of renewable energy facilities) due to the spread of renewable energy | Increased capital investment costs due to introduction of renewable energy facilities | Small | Small | ー | ー | |||
| An increase in waste disposal costs due to stricter waste disposal regulations and standards. | (Quantification planned if the impact of waste disposal costs becomes measurable) | |||||||
| An increase in GHG emission price | An increase in taxation costs (operating costs) due to the increased introduction of carbon taxes and carbon levies | Increased operating costs due to increased tax obligations | Large | Large | Small | Medium | ||
| Technology | Transition to low carbon products due to investment in new technologies | A substantial increase in capital expenditures (installation costs of high-efficiency facilities) due to the development and introduction of high energy-efficient technologies | Increased capital investment costs due to introduction of high-efficiency facilities | Medium | Large | ー | ー | |
| Industry/market | A substantial increase in raw material prices | An increase in petroleum-derived raw materials procurement costs due to soaring fossil fuel prices | Increased procurement costs due to higher petroleum-derived materials prices | Medium | Large | Large | Large | |
| An increase in petroleum-derived raw material costs due to carbon taxes and other taxes in the upstream of the value chain passed on to raw materials | ||||||||
| Increase in transport costs due to higher fossil fuel prices. | (Quantification planned if the transport costs become identifiable) | |||||||
| An increase in energy prices due to soaring fossil fuel prices | Increased energy costs associated with fossil fuel prices | ー | ー | Medium | Medium | |||
| Physical risks | Acuteness | Occurrence of abnormal weather and natural disaster (acute) | Damage to the company’s buildings, facilities, infrastructure, etc., plant shutdowns, and lost opportunities (decrease in revenue) due to a flood, high tide, etc. | Damage to assets due to damage to or suspension of facilities and infrastructure | Medium | Medium | Medium | Large |
| Suspension of operation at the company’s plants, loss of opportunities (decrease in revenue) due to major suppliers being hit by a flood, high tide, etc. | Opportunity loss due to damage to or suspension of facilities and infrastructure | Small | Small | Small | Small | |||
| Chronic | Sea level rise | Suspension of Nitto plants due to flooding, etc. | (No relevant Nitto plants) | |||||
| Opportunities | Products/services | An increase in demand for low-carbon products(Change in preferences) | An increase in revenue from products contributing to the environment due to increased demand for recycled products | Increased revenue from products contributing to the environment | Medium | Large | ー | ー |
| An increase in demand for medical-related products (response to infectious disease) | An increase in revenue from medical-related products due to an increase in health damage, such as infectious diseases due to rising average temperature | Increased revenue from medical-related products | ー | ー | Large | Large | ||
| Monetary impact Small: less than 3 billion yen; Medium: 3 to less than 10 billion yen; Large: 10 billion yen or over.
Those marked with a hyphen are not evaluated as the business impact is expected to be minimal. |
||||||||
Under the 1.5°C scenario, the major factors of profit decline are as follows: increase in transition costs (raw material costs) to low GHG-emitting raw materials, increase in taxation costs (operating costs) due to the increased introduction of carbon taxes and carbon levies, and increase in petroleum-derived raw material costs due to carbon taxes and other taxes in the upstream of the value chain passed on to raw materials.
On the other hand, we expect revenue from products contributing to the environment (PlanetFlags™) to increase due to increased demand for recycled products.
Under the 4°C scenario, the major factors of profit decline are as follows: increase in petroleum-derived raw materials procurement costs due to soaring fossil fuel prices, and damage to the company’s buildings, facilities, infrastructure, etc., plant shutdowns, and lost opportunities (decrease in revenue) due to a flood, high tide, etc. On the other hand, we expect revenue from medical-related products, from among our products contributing to human life (HumanFlags™), to increase with the increase of health damage, such as infectious diseases due to rising average temperature.
We have reviewed our responses to risks and opportunities under the respective scenarios.
Under the 1.5°C scenario, we will take the following measures to minimize risk: promote energy saving in the manufacturing process by shifting to solvent-free processes, achieve energy saving by improving infrastructure and utility efficiency, and strive to utilize fully renewable energy. Furthermore, by promoting the development of recycled materials in cooperation with our suppliers, we will reduce the usage of raw materials through the effective procurement of sustainable materials and effective utilization of resources.
These measures will enable the reduction of GHG emissions, which will in turn enable us to mitigate the increased taxation costs by approximately 50% due to the increased introduction of carbon taxes and carbon levies by 2030. Since we expect to achieve carbon neutrality in our GHG emissions (Scope 1 and 2) by 2050, we do not believe our costs will increase.
Additionally, as we can reduce our power purchases by energy saving and using renewable energy, we believe it will be possible to mitigate the increase in capital expenditures due to the development and introduction of high energy-efficient technologies by approximately 50% by both 2030 and 2050.
Under the 4°C scenario, we will take the following measures to minimize risk: reduce the usage of raw materials through the effective utilization of resources and develop preemptive prevention measures through the promotion of business continuity management (BCM) across Nitto Group business locations. We believe these measures will enable us to mitigate the increase in petroleum-derived raw materials procurement costs due to soaring fossil fuel prices, as well as the damage to the company’s buildings, facilities, infrastructure, etc., plant shutdowns, and lost opportunities due to a flood, high tide, etc. by both 2030 and 2050.
Under the 1.5°C scenario, we will work on expanding our lineup of products contributing to the environment (PlanetFlags™) in order to maximize opportunities. We expect revenue from products contributing to the environment to increase due to increased demand for low-carbon products such as recycled products.
Similarly, under the 4°C scenario, we will work on expanding our lineup of products contributing to human life (HumanFlags™). We expect revenue from medical-related products due to an increase in health damage, such as infectious diseases due to rising average temperatures.
We believe we will be able to maintain a certain level of profit by consistently creating PlanetFlags™ and HumanFlags™.
Please see here for PlanetFlags™/HumanFlags™.
The results of the scenario analysis have been incorporated into 2030 management indicators, including Nitto Group Carbon Neutral 2050, and into the mid-term management plan Nitto RISE 2028, confirming the effectiveness of the strategy.
Our 80-billion-yen investment for decarbonization over the ten-year period from 2021 to 2030 is being directed primarily to minimize the risks assumed in the 1.5°C scenario: shifting to solvent-free processes, improving infrastructure and utility efficiency, and using renewable energy. Scenario analysis has shown that these measures will enable us to save more than 10 billion yen in costs in 2030 on a single-year basis. Therefore, we believe the expected benefits make it a reasonable investment.
We consider this as validation of the resilience of our strategies for both the 1.5°C scenario and 4°C scenario, and will aim to minimize risks and maximize opportunities even further moving forward.
The Group has set “responding to climate change” as one of its material issues for sustainability and believe that reducing GHG emissions, a cause of global warming, is essential for a sustainable growth and the realization of a sustainable environment and society, and that it is an important social responsibility. Therefore, the Group aims to achieve carbon neutrality in our GHG emissions (Scope 1+2) by 2050, and has declared the Nitto Group Carbon Neutral 2050.
In addition, the Group ensures that the countermeasures are implemented to minimize risks and maximize opportunities and has established 2030 management indicators and targets to regularly monitor and manage the progress of those countermeasures. In order to achieve our ideal state through the resolution of Material Issues for Sustainability, the Nitto Group as a whole has established “GHG emissions,” “Renewable energy ratio,” “Resource utilization ratio,” “Sustainable materials procurement ratio,” and “Flags revenue ratio” as materiality KPIs.
Moreover, for GHG emissions (Scope 1+2), for which the overall target is 400 kton*1, the Group has set individual targets 330 kton for GHG emissions (Scope 1) and 70 kton for GHG emissions (Scope 2)—to enhance the effectiveness of activities.
Although we have previously focused on improving our waste plastics recycling ratio, given that plastics account for roughly half of our total waste, we newly introduced the resource utilization ratio, to promote the active circular use of a broader range of resources beyond plastics.
*1 In August 2024, we set science-based GHG emissions reduction targets (Scope 1+2 and Scope 3) aligned with the 1.5°C pathway and obtained the SBT (Science Based Targets) certification.
The indicators and targets for the individual risks and opportunities by 2030 are as follows.
| Type of risk/opportunity | Event | Assumed risks and opportunities | Countermeasures | Indicators | Targets (2030) | |
|---|---|---|---|---|---|---|
| Transition risks | Policy and laws and regulations | Strengthening of low carbon regulations | An increase in transition costs (raw material costs) to low GHG-emitting raw materials | Conversion of raw materials to alternaives, weight reduction of products
Promotion of the development of recycled materials in cooperation with suppliers |
Reduction of raw material usage
GHG emissions (Scope 3) *1*3 |
ー
1,460kton or less |
| A substantial increase in renewable energy procurement costs due to the spread of renewable energy | Implementation of the Domestic Renewable Energy Procurement Master Plan (stable procurement, including solar power generation system outside the premises)
Promotion of PPA procurement |
Renewable energy ratio *2*4 | 100%
(2030: in Japan, 2035: in group-wide) |
|||
| An increase in capital expenditures (installation costs of renewable energy facilities) due to the spread of renewable energy | Introduction/Installation of solar power generation system on the premises (in Japan and abroad) | |||||
| An increase in GHG emission price | An increase in taxation costs (operating costs) due to the increased introduction of carbon taxes and carbon levies | Reduction of GHG emissions (Scope 1+2) through promoting use of renewable energy, shifting to solvent-free processes, and improving infrastructure and utility efficiency | GHG emissions(Scope 1)*1*3
GHG emissions(Scope 2)*1*3 |
330kton or less
70kton or less |
||
| Technology | Transition to low carbon products due to investment in new technologies | A substantial increase in capital expenditures (installation costs of high-efficiency facilities) due to the development and introduction of high energy-efficient technologies | Promotion of solvent-free technology (UV, emulsion, hot-melt adhesive)
Improvement of infrastructure and utility efficiency |
|||
| Industry/
market |
A substantial increase in raw material prices | An increase in petroleum-derived raw materials procurement costs due to soaring fossil fuel prices | Effective utilization of resources | Reduction of raw material usage
GHG emissions(Scope 3)*1*3 |
ー
1,460kton or less |
|
| An increase in petroleum-derived raw material costs due to carbon taxes and other taxes in the upstream of the value chain passed on to raw materials | Effective utilization of resources (including product design (light weighting and yield improving), reuse, recycling, etc.)
Promotion of the shift from oil-based raw materials to sustainable materials (bio materials/recycled materials) |
Sustainable materials procurement ratio *2
Resource utilization ratio *2 GHG emissions(Scope 3)*1*3 |
30% or more
69% or more 1,460kton or less |
|||
| An increase in energy prices due to soaring fossil fuel prices | Promotion of energy saving, shift to solvent-free processes, electrification | GHG emissions(Scope 1)*1*3
GHG emissions(Scope 2)*1*3 |
330kton or less
70kton or less |
|||
| Physical risks | Acuteness | Occurrence of abnormal weather and natural disaster (acute) | Damage to the company’s buildings, facilities, infrastructure, etc., plant shutdowns, and lost opportunities (decrease in revenue) due to a flood, high tide, etc. | Promotion of business continuity management (BCM) at an individual Nitto-Group business location level | Continuous implementation of BCM at a group level and an individual business location level | ー |
| Suspension of operation at the company’s plants, loss of opportunities (decrease in revenue) due to major suppliers being hit by a flood, high tide, etc. | Promotion of sustainable procurement (risk management) | BCP planning at partners System to check the safety of and impact on partners | ー | |||
| Opportunities | Products/
services |
An increase in demand for low-carbon products (Change in preferences) | An increase in revenue of products contributing to the environment due to increased demand for recycled products | Expansion of the PlanetFlags product lineup | Flags revenue ratio *3 | 50% or more |
| An increase in demand for medical-related products (response to infectious disease) | An increase in revenue of medical-related products due to an increase in health damage, such as infectious diseases due to rising average temperature | Expansion of the HumanFlags product lineup | ||||
*2 materiality KPIs
*3 future-financial indicators and materiality KPIs
*4 Nitto joined Renewable Energy 100% (RE100) in May 2024 and aims to achieve RE100 globally by 2035.
We enhance the feasibility of the indicators and targets for each risk and opportunity by not only implementing management on a group level, but also by allocating group targets to the business execution departments, setting individual targets for each business execution department, and developing business-specific measures in addition to group-wide measures. Each business execution department confirms the progress toward target achievement monthly; the department in charge of the environment manages the progress on a group-wide basis and provides a report to the Corporate Strategy Meeting. The indicators and targets are reviewed once a year to make any necessary revisions depending on the progress status or changes in the external environment. Further, the future-financial indicators are reviewed when we update the mid-term management plan once every three years, and revisions are made following review and decision by the Board of Directors.
In fiscal 2025, the CO2 emissions (Scope 1 + Scope 2) amounted to 361 kton. We steadily reduced CO2 emissions and achieved the 2025 target of 470 kton.
The Nitto Group has thus far worked to reduce its energy consumption as part of its efforts to reduce CO2 emissions. For example, we are advancing multifaceted energy‑saving initiatives, including the shift to solvent‑free products, the effective utilization of waste heat, and the introduction of high‑efficiency equipment. We are also continuing medium‑ to long‑term procurement through the use of Power Purchase Agreements (PPAs) and promoting the transition to renewable energy.
Going forward, we will work toward achieving our 2030 targets—330 kton for GHG emissions (Scope 1) and 70 kton for GHG emissions (Scope 2)—by reducing GHG emissions across our supply chain and advancing the planned procurement of corporate PPAs.
| Indicators | FY2020 (Base Year) | FY2024 | FY2025 | FY2028 Target | FY2030 Target |
|---|---|---|---|---|---|
| GHG(CO2) emissions(Scope1) | ー | 291kton | 272kton | 300kton | 330kton or less |
| GHG(CO2) emissions(Scope2) | 181kton | 89kton | 100kton | 70kton or less | |
| GHG(CO2) emissions(Scope1+2) | 746kton | 472kton | 361kton | 400kton | 400kton or less |
| Revenue intensity (Scope1+2) | ー | 0.47 ton / Million yen | 0.35 ton / Million yen | ー | ー |
The Nitto Group accurately calculates and reports GHG emissions in accordance with the GHG Protocol in order to identify areas in the supply chain that should be prioritized for reduction. The details of the calculation method for CO2 emissions (Scope 1 and 2) are as follows.
| Data(Unit) | Calculation method |
|---|---|
| CO2 emissions
Scope 1: Direct emissions Scope 2: Energy indirect emissions (kton) |
GHG emissions quantification is subject to uncertainty when measuring activity data, determining emission factors, and considering scientific uncertainty inherent in the Global Warming Potentials.
The calculation method is based on emission coefficient of “A Corporate Accounting and Reporting Standard Revised Edition” issued by The Greenhouse Gas Protocol. The emission factor is shown as below. a ) Energy (fuel, steam): Coefficient stipulated in ”Act on Promotion of Global Warming Countermeasures”b ) Energy (hot water): Emission coefficients for each suppliersc ) Energy (electric power): (market) Figures of Japan, Germany indicates emission coefficients by electric power companies, And figures of Vietnam and Taiwan indicates emission coefficients by government. Other areas are calculated by regional coefficients provided by the International Energy Agency’s (IEA) CO2 Emissions from Fuel Combustion, and the United States Environmental Protection Agency’s (EPA) Emissions & Generation Resource Integrated Database (eGRID). (Location) Figures of Japan indicates Japan domestic average, figures of U.S. calculated by the United States EPA eGRID, and other areas are calculated by regional coefficients provided by IEA.d ) Materials burned by Nitto Gr. (solvent): Coefficient decided by Nitto assuming combustion reaction of solvent |
In fiscal 2025, the CO2 emissions (Scope 3) amounted to 1,391 kton.
We are estimating the reduction effects of transforming our business portfolio, improving yield, and switching to sustainable materials and incorporating these into our reduction measures. For raw materials and transportation, the cooperation of our suppliers is essential. We have been promoting supplier engagement activities and, in fiscal 2025, improved calculation accuracy by obtaining primary data on raw materials from our suppliers.
Going forward, we will continue to discuss the Scope 3 categories with a focus on those with high emissions together with business execution departments through the Global Green Committee and take timely actions.
| Indicators | FY2022
(Base Year) |
FY2024 | FY2025 | FY2028 Target | FY2030 Target |
|---|---|---|---|---|---|
| GHG(CO2) emissions(Scope3) | 1,949kton | 1,859kton | 1,391kton | 1,520kton | 1,460kton or less |
Target categories: 1. Purchase of raw materials, 3. Fuel production and electricity generation, 4. Transportation (purchase and outbound logistics), 5. Waste disposal, 12. Product disposal
The details of the calculation method for CO2 emissions (Scope 3) are as follows.
| Data(Unit) | Calculation method |
|---|---|
| CO2 emissions emissions
Scope 3: Other indirect emissions |
GHG emissions quantification is subject to uncertainty when measuring activity data, determining emission factors, and considering scientific uncertainty inherent in the Global Warming Potentials.
|
In fiscal 2025, the waste plastics recycling ratio was 54%, achieving the 2025 target of 50%.
We have been advancing the development of plastics recycling technologies. In fiscal 2025, we invested approximately 100 million yen to install demonstration facilities at the Toyohashi Plant and have been advancing efforts to address further technical challenges. This time our uniforms made using recycled plastic have been completed, and we have begun using them within the company.
The resource utilization ratio newly introduced in fiscal 2025, reached 72%, achieving the 2030 target of 69%. Based on this, we plan to review both the 2030 targets and the calculation methodology during fiscal 2026.
Going forward, we will work to improve the resource utilization ratio by further promoting more efficient use of resources through yield improvement and waste recycling.
| Indicator | FY2024 | FY2025 | FY2030 Target |
|---|---|---|---|
| Resource utilization ratio | 66% | 72% | 69% or more |
In fiscal 2025, sustainable materials procurement ratio was 24%, achieving the 2025 target of 20%.
In fiscal 2025, we expanded the scope of aggregation to a global basis, thereby reflecting the performance of the EMEA region, where the procurement ratio of biomass‑derived raw materials such as pulp is high. Additionally, as part of our transition to sustainable materials, we began procuring polysulfone and ethyl acetate certified under the mass balance approach*5, and at certain sites in the EMEA region, we have switched to 100% biomass‑derived ethyl acetate.
Going forward, we will continue to promote the transition to sustainable materials by further advancing our raw material strategy and strengthening collaboration with our suppliers.
| Indicator | FY2024 | FY2025 | FY2030 Target |
|---|---|---|---|
| Sustainable materials procurement ratio | 18% | 24% | 30% or more |
*5 mass balance approach: A method in which, when a raw material with certain characteristics (e.g., biomass-derived raw material) is mixed with a raw material without those characteristics (e.g., petroleum-derived raw material), a portion of the product is allocated those characteristics in proportion to the amount of raw material input.
In fiscal 2025, the PlanetFlags™/HumanFlags™ category revenue ratio was 46%.
As concerns about climate change continue to grow, the development of PlanetFlags™ products that help address environmental issues is becoming increasingly important and urgent. For this to happen, we must seek collaboration with partners within and outside the company. Through the avenue of the Global Green Committee, which facilitates the decarbonization and resource recycling processes by way of technological changes, we will create new PlanetFlags™ products with the three axes of business divisions, regional headquarters, and functional departments cooperating organically. At the same time, we will work closely with business partners and suppliers to take diverse measures to accelerate the commercialization process, including gaining a stake in startups and venture businesses.
| Indicator | FY2024 | FY2025 | FY2028 Target | FY2030 Target |
|---|---|---|---|---|
| Flags revenue ratio | 44% | 46% | 50% | 50% or more |
Please see here for past data on our Scope 1, 2, and 3 emissions and other individual key management indicators.
In addition, of the 80 billion yen in decarbonization investments being promoted from 2021 to 2030, 37.2 billion yen in decarbonization-related investments are being carried out over the five-year period from fiscal 2021 to fiscal 2025.
These are mainly used for energy conservation through improvements in equipment operations and upgrades to high-efficiency equipment, as well as for increasing the use of renewable energy through the installation of new solar power generation facilities and the expansion of existing ones.
The Nitto Group has implemented environmental investment based on internal carbon pricing (ICP) in order to ensure achievement of the 2030 Management Targets (CO2 emissions) committed in Nitto Group Carbon Neutral 2050. We are promoting investment, primarily in new environmental technology and facilities, at an assumed internal carbon price of 10,000 yen/t-CO2 based on consideration of EU-ETS and other external trends.